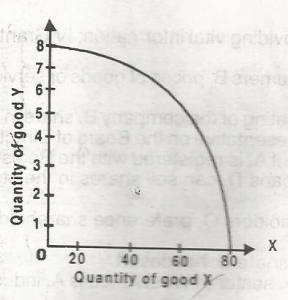
The above diagram showing the maximum possible combination of commodities X and Y produced in Nigeria is called the
a
Production indicator
b
Maximum production curve
c
Production possibility curve
d
Total output curve
Explanation
Correct Option
cNo explanation available
Video Explanation
No video available
Post your Contribution
Share:
Discussions (0)
No comments yet
Be the first to comment

