Use this above diagram to answer this question. From the table, the mean of the distribution is
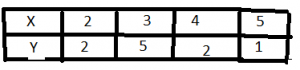
a
2.2
b
2.5
c
3
d
4.5
Explanation
Correct Option
cVideo Explanation
No video available
Post your Contribution
Share:
Use this above diagram to answer this question. From the table, the mean of the distribution is
2.2
2.5
3
4.5
No video available


