a
excess demand over supply at q3
b
excess supply over demand at q2
c
minimum price legislation at P2
d
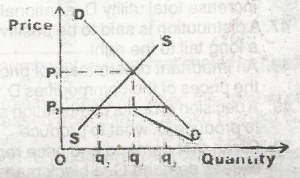
maximum price legislation at P2
Explanation
Correct Option
aNo explanation available
Video Explanation
No video available
Post your Contribution
Share:
Discussions (4)

Iember_codes
3 years ago
JAMB:The diagram above shows the effect of?
Me: Not using a good camera to take a picture and web devs not optimising image . Option:confusionnnnnnnnnnnnnn

klickinstitute
3 years ago
the correct answer is D, maximum price legislation is a fixed price below the equilibrium price

