The diagram above shows the shifts in both demand supply curves. What is the new equilibrium point after the shifts?
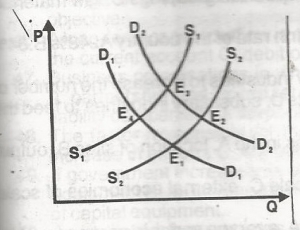
a
E3
b
E1
c
E4
d
E2
Explanation
Correct Option
dNo explanation available
Video Explanation
No video available
Post your Contribution
Share:
Discussions (0)
No comments yet
Be the first to comment

