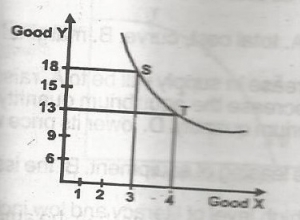
In the diagram above, the marginal rate of substitution of X for Y, for a movement from S to T is


To produce 18 units of Y, at point S, 3 units of X was produced at the same point S. A movement along the production chart from point S to T, the firm gave up 5 units of Y to produce 4 units of X. This means that the firm gave up 5 units of product Y to produce 1 additional unit of X.
The ratio of substitution is 5:1


Contributions ({{ comment_count }})
Please wait...
Modal title
Report
Block User
{{ feedback_modal_data.title }}