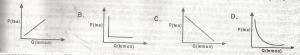
Which of the following graphs represents the price-quantity relationship between tea and lemon, if they are perfect complements? choose the answer from the option above

a

A

b

B

c

C

d

D

Download Offline App Ask a Question

Explanation

Correct Option
b

No explanation available

Video Explanation

No video available

Post your Contribution

Share:

Discussions (2)

olawalekaka
6 years ago

the right answer is C

Quick Questions

Ask a Question
CO

ceoofwahala

20th June, 2026

Chemistry


2 comments

ASSAAS

20th June, 2026

English Language


5 comments

infinitehoaxx

21st May, 2026

Computer


4 comments