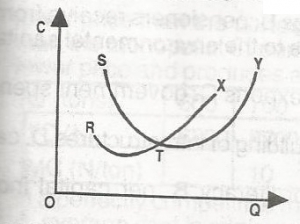
In the diagram above, RTX and STY are the marginal cost and the average cost curves responsively of a perfectly competitive firm. The supply curve of the firm is indicated by
A.
TX
B.
RT
C.
ST
D.
TY
Correct Answer: Option A
Explanation
No official explanation is available for this question at this time. Please check contributions posted by others below. If you can provide an explanation to help other student learn, please click here


Contributions ({{ comment_count }})
Please wait...
Modal title
Report
Block User
{{ feedback_modal_data.title }}