Economics
JAMB 1984
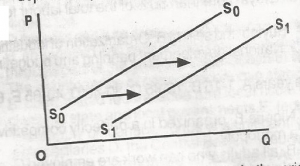
In the diagram, the supply curve So So shifts to a new position S
1 S
1 to indicate
-
A.
a drop in supply
-
B.
a rise in supply
-
C.
a supply- push inflation
-
D.
a stable supply curve
-
E.
an increase in quantity supplied
Correct Answer: Option B
Explanation
No official explanation is available for this question at this time. Please check contributions posted by others below. If you can provide an explanation to help other student learn, please
click here
Report an Error
Ask A Question
Download App
Quick Questions


Contributions ({{ comment_count }})
Please wait...
Modal title
Report
Block User
{{ feedback_modal_data.title }}