concentration
temperature
surface area
pressure
Explanation
No explanation available
Video Explanation
Post your Contribution
Discussions (6)

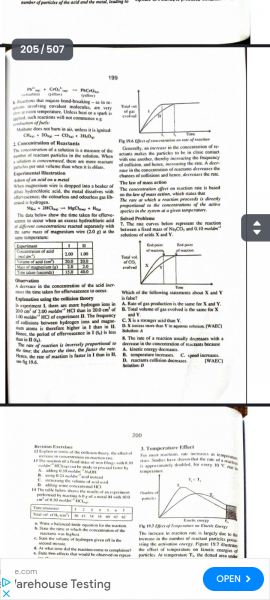

The graph shows rate of reaction vs time with:
A very high rate at the beginning
Then a rapid decrease, followed by a slow leveling off
✅ Correct answer: Concentration
Explanation:
At the start, concentration of reactants is high → many collisions → high reaction rate.
As time goes on, reactants are used up, so concentration decreases.
Fewer particles → fewer collisions → rate drops.
Why others are wrong:
Temperature: Would change the rate but not gradually decrease over time like this.
Surface area: Usually constant during the reaction (unless stated).
Pressure: Only affects gases and would not naturally decrease like this over time.
👉 So the graph best shows the effect of decreasing concentration of reactants during a reaction
Courtesy: Chatgpt

