Chemistry
WAEC 2015
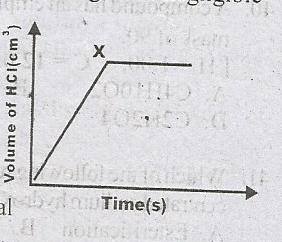
The following diagram illustrates the rate curve that was obtained when Mg reacted with excess dilute HCl.
The diagram became horizontal at X because
-
A.
The reaction was slowed down
-
B.
All the dilute HCl has reacted
-
C.
All the Mg has reacted
-
D.
Hydrogen gas is produced at a steady rate
Correct Answer: Option C
Explanation
No official explanation is available for this question at this time. Please check contributions posted by others below. If you can provide an explanation to help other student learn, please
click here
Report an Error
Ask A Question
Download App
Quick Questions


Contributions ({{ comment_count }})
Please wait...
Modal title
Report
Block User
{{ feedback_modal_data.title }}