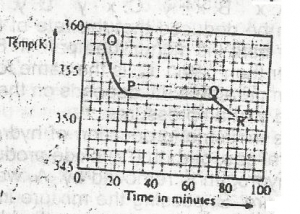
Use the graph above to answer this question. A sample, X, solid at room temperature, was melted, heated to a temperature of 358 K and allowed to cool as shown in OPQR.The section OP suggests that X is in the
a
liquid sate
b
solid/liquid state
c
solid state
d
gaseous state
Explanation
Correct Option
aNo explanation available
Video Explanation
No video available
Post your Contribution
Share:
Discussions (8)

anathesia
1 year ago
here's the thing, looking at the question, it said the substance had already been melted, meaning it was already in a liquid form and further heated to 398k
Now, when it was left to cool, the downward slope would mean that this liquid was losing heat, hence it should be noted that, it was still in it's liquid state
the best phase which vis the straight line indicates a solidification process

Abdullahi113
1 year ago
the substance is in solid state after heat has been applied it change to liquid state the slope OP means melting and it is the transformation of solid to liquid
SammyBOSS04
3 years ago
The liquid is half solid have liquid because it's at its freezing point.
B is the correct answer

