The above graph shows a typical heating curve from the solid phase through the liquid phase to the gaseous phase of a substance. Which part of the curve shows solid and liquid in equilibrium?
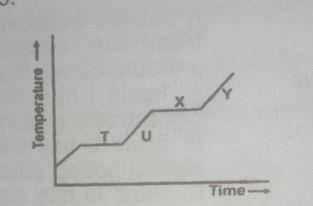
a
T
b
U
c
X
d
Y
Explanation
Correct Option
aVideo Explanation
No video available
Post your Contribution
Share:
Discussions (6)

King33Victor
2 months ago
myschool the question says solid and liquid not
solid to liquid so ooo be careful.
the answer is X


