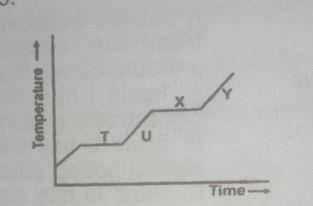
The above graph shows a typical heating curve from the solid phase through the liquid phase to the gaseous phase of a substance. Which part of the curve shows solid and liquid in equilibrium?


point T shows solid-liquid equilibrium. At this point, the substance been heated has begun to melt but has not completely melted forming a solid liquid mixture.


Contributions ({{ comment_count }})
Please wait...
Modal title
Report
Block User
{{ feedback_modal_data.title }}