Boyle
Charles
Graham
Gay-Lussac
Explanation
No explanation available
Video Explanation
No video available
Post your Contribution
Discussions (16)

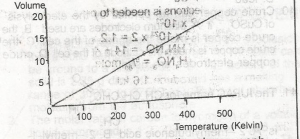
the answer is Charles law cause according to Charles law, at constant pressure, volume is directly proportional to temperature.


what is meant to be on the x-axis? i couldn't answer the question because it is not clear
In the graph we have temperature and volume, which law describes the relationship between temperature and pressure of a gas?
Charles Law. Simple
Ooopz...the answer is boyle's law cos as the volume of the gas increases,the rtemperature also increases

charle's law deals with only volume(cm) and temperature(kelvin) so option B is correct.

Definately Charles law. Volume is directly proportional to temp in Kelvin. At constant pressure

this simply means that if the volume of a gas at 0 degree celcius is 173m3 at-1 degree celcius it volume wouid be272m at -2oc it volume will reduce to 271m3

