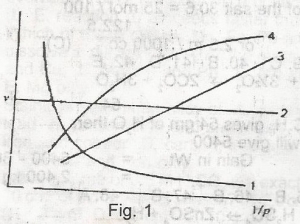
Which of the curves shown in the figure given represents the relationships between the volume(V) and pressure(P) of an ideal gas at constant temperature
1
2
3
4
1 and 3
Explanation
No explanation available
Video Explanation
No video available
Post your Contribution
Discussions (12)

it is talking about graphical representation of boyles law
using v and the inverse of p
The question is about V and P which signifies Boyle's law... V inversly proportional to p thus, when v is much, p is little, and vice versa, A is the answer pls, which is 1


To identify the correct graph representing the relationship between volume (V) and pressure (P) of an ideal gas at constant temperature, we use Boyle’s Law, which states:
PV = {constant}=>V \proportional to{1}/{P}
This implies that a plot of V vs 1/P should be a straight line through the origin.
Now looking at the figure:
• Curve 3 is a straight line starting from the origin and increasing linearly with \frac{1}{P} , matching Boyle’s Law.
• Curve 1 is a hyperbola-like curve, which would represent V vs P directly, not V vs 1/P.
• Curves 2 and 4 do not match the expected linear relationship.
Correct answer: C. 3


