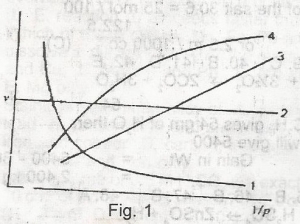
Which of the curves shown in the figure given represents the relationships between the volume(V) and pressure(P) of an ideal gas at constant temperature
A.
1
B.
2
C.
3
D.
4
E.
1 and 3
Correct Answer: Option C
Explanation
No official explanation is available for this question at this time. Please check contributions posted by others below. If you can provide an explanation to help other student learn, please click here


Contributions ({{ comment_count }})
Please wait...
Modal title
Report
Block User
{{ feedback_modal_data.title }}