The following graph demonstrates the rate of reaction between calcium carbonate (marble)and dilute hydrochloric acid. The graph shows that the rate of reaction is initially greatest when
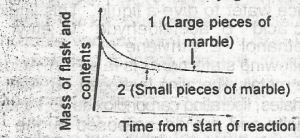
the initial slope of the curve is steepest and this occur when small pieces of marble are used and is due to a small surface area of reactant
the occur when large pieces of marble are used and is due to a small surface area of reactant
the initial slope of the curve is steepest and this occurs when small pieces of marble are used and is due to a large surface area of reactant
the initial slope of the curve is steepest and this occur when large surface area of reactant
the initial slope of the curve is least steep and this occur when small pieces of marble are used and is due to the increased surface area of the reactant
Explanation
No explanation available
Video Explanation
No video available
Post your Contribution
Discussions (4)

Increase in size decreases surface area. Decrease in size increases surface area. Therefore,the initial slope of the curve is steepest or has a sharp inclination and this occurs when small pieces of marble are used and is due to a large surface area of reactant. 🖊️😒

