Use the diagram above to answer this question.

The graph illustrates

a

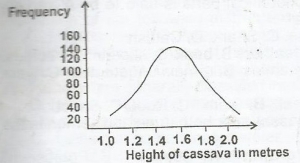
the highest frequency for height of 2 metres

b

a discontinuously varying character

c

a continuously varying character

d

total yield in a cassava farm

Download Offline App Ask a Question

Explanation

Correct Option
c

No explanation available

Video Explanation

Post your Contribution

Share:

Discussions (6)

bettyamaka
8 years ago

please the graph involves height therefor the correct answer is C that is continuous variation. my school plz correct the mistake oooo!

Gobbler
9 years ago

Height is a morphological or continuously varying character. Please review

Prep2025
1 year ago

I don't understand Ur explanation

Nwese
5 years ago

😡the answer is C biko

dessie9001
9 years ago

true

Quick Questions

Ask a Question
CO

ceoofwahala

20th June, 2026

Chemistry


2 comments

ASSAAS

20th June, 2026

English Language


5 comments

infinitehoaxx

21st May, 2026

Computer


4 comments