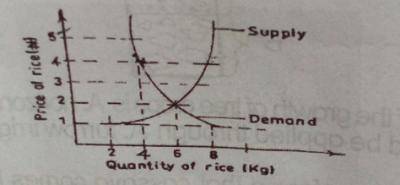
Study the graph illustrated above and answer this question correctly
The graph best_____________
A.
shows an increase in the supply of rice
B.
describes a shift in the demand for rice
C.
describes the equilibrium price for rice
D.
shows that the demand for rice exceeds supply
Correct Answer: Option C
Explanation
No official explanation is available for this question at this time. Please check contributions posted by others below. If you can provide an explanation to help other student learn, please click here


Contributions ({{ comment_count }})
Please wait...
Modal title
Report
Block User
{{ feedback_modal_data.title }}