


(a) Given that cos x = 0.7431, 0° < x < 90°, use tables to find the values of : (i) 2sin x ; (ii) tan\(\frac{x}{2}\).
(b) The interior angles of a pentagon are in ratio 2 : 3: 4: 4: 5. Find the value of the largest angle.
(a) Given the expression \(y = ax^{2} - bx - 12\) , find the values of x when a = 1, b = 2 and y = 3.
(b) If \(\sqrt{x^{2} + 1} = \frac{5}{4}\), find the positive value of x.
Using ruler and a pair of compasses only,
(a) construct \(\Delta PQR\) such that |PQ| = 7 cm, |PR| = 6 cm and < PQR = 60°.
(b) locate point M, the mid-point of PQ.
(c) Measure < RMQ.
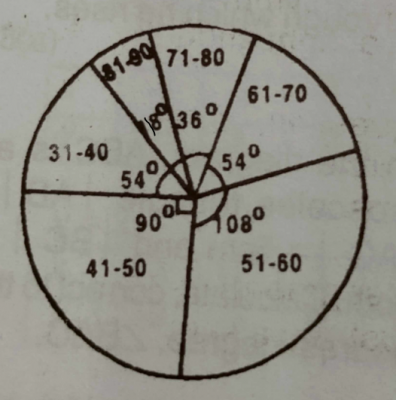
The pie chart above shows the distribution of marks scored by 200 pupils in a test.
(a) How many pupils scored : (i) between 41 and 50 marks? ; (ii) above 80 marks?
(b) What fraction of the pupils scored at most 50 marks?
(c) What is the modal class?
(a)
| Limes | Apples | |
| Good | 10 | 8 |
| Bad | 6 | 6 |
The table shows the number of limes and apples of the same size in a bag. If two of the fruits are picked at random, one at a time, without replacement, find the probability that : (i) both are good limes ; (ii) both are bad fruits ; (iii) one is a good apple and the other a bad lime.
(b) Solve the equation \(\log_{3} (4x + 1) - \log_{3} (3x - 5) = 2\).

