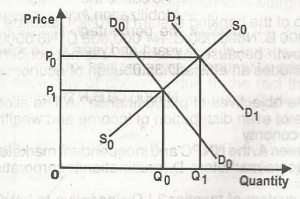
From the diagram above, a shift in the demand curve from DoDo to D1D1 implies
A.
a rise in the demand for the commodity
B.
a fluctuation in the demand for the commodity
C.
a fall in the demand for the commodity
D.
an equilibrrium in the demand for the commodity
Correct Answer: Option A
Explanation
No official explanation is available for this question at this time. Please check contributions posted by others below. If you can provide an explanation to help other student learn, please click here


Contributions ({{ comment_count }})
Please wait...
Modal title
Report
Block User
{{ feedback_modal_data.title }}